Charts
 Version 1.0.5
Charts are created from rows of data in the grid that update automatically and live inside the model, eliminating the need to switch back and forth between modeling and data visualization applications. Charts are shown on a dedicated Charts tab at the bottom of the screen. Create them from the elements tab of the ribbon.
 Version 1.0.6
Create a chart
Section titled “Create a chart”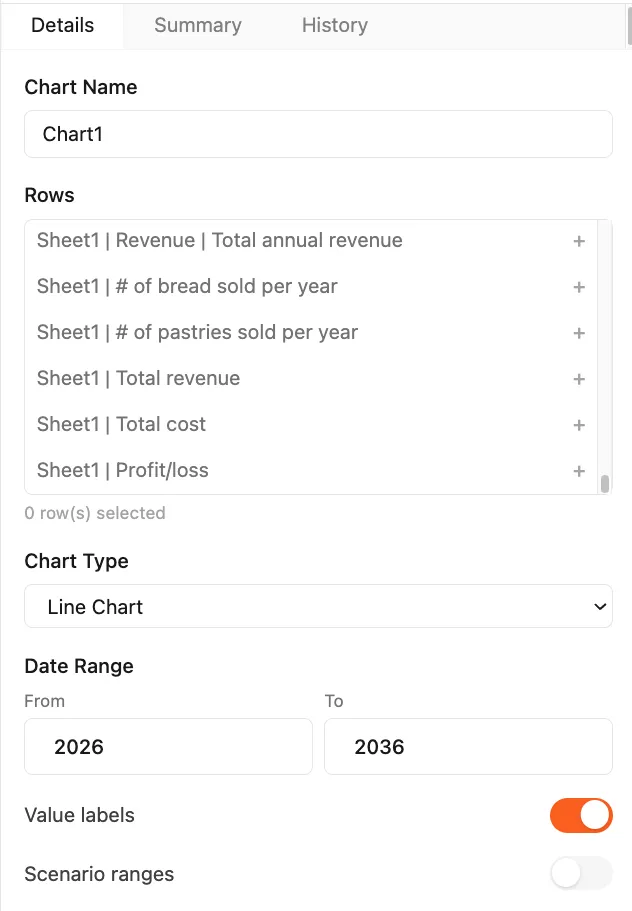 Version 1.0.6
To create a chart, click the Charts button on the elements tab in the ribbon or navigate to the Charts tab and press the + Add button. The chart creation interface will appear in the control panel, including:
-
Chart name: Set the name of the chart that will be shown in the control panel
-
Chart type: Select the desired chart style. Available types:
- Line
- Bar
- Stacked Bar
- Area
-
Date range: Select the time periods covered by the chart
-
Rows: Select the rows to plot on the chart
-
Point values: Toggle point values in line charts and bar totals in bar charts
-
Scenario ranges: Add a shaded region around each line in the chart that shows the minimum and maximum values created by all possible combinations of user-defined scenarios
Edit a chart
Section titled “Edit a chart”To edit an existing chart, navigate to the Charts tab and click on the chart to reopen the chart settings in the details tab of the control panel.
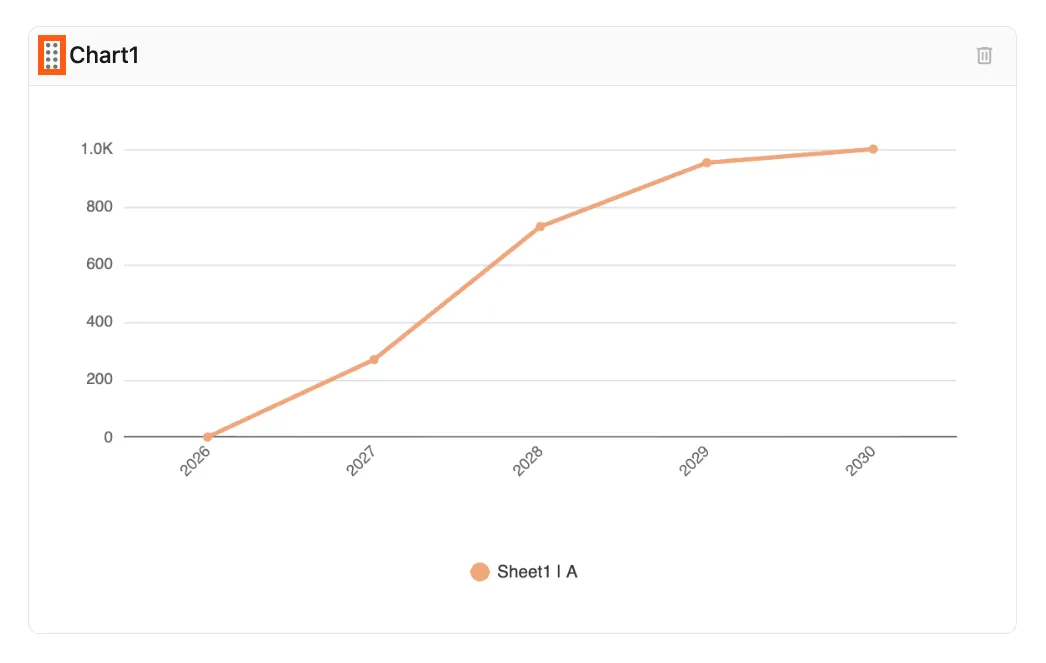
The order of charts can be rearranged by clicking and dragging on the handle next to each chart name.
 Version 1.0.6
Delete a chart
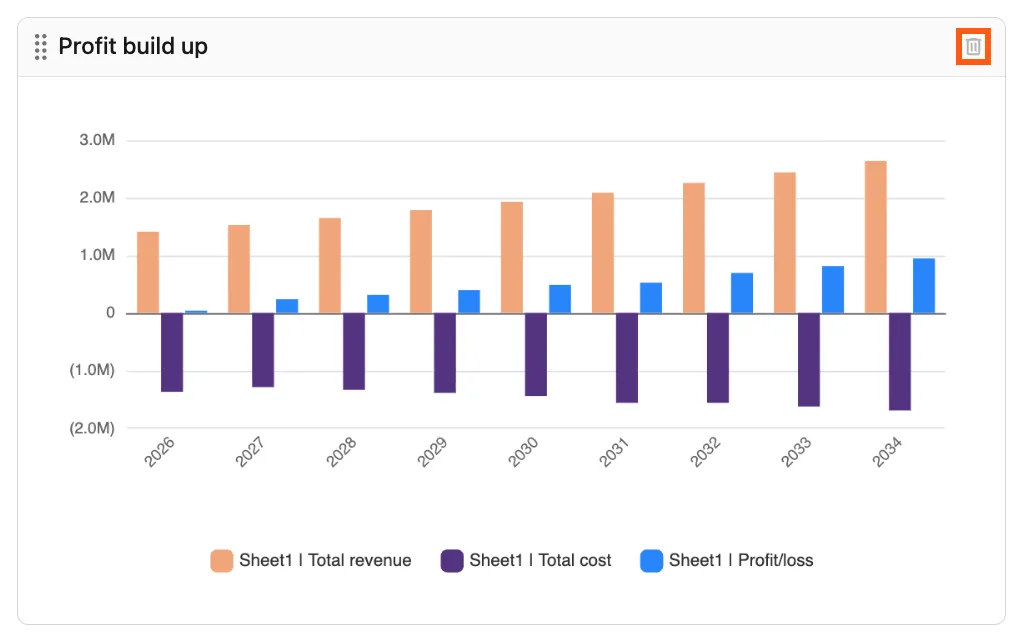
Section titled “Delete a chart”To delete an existing chart, navigate to the Charts tab and click the delete button at the top of the chart.
 Version 1.0.6