Interpolation
Instead of having to create a new model if greater or lesser time interval granularity is needed, Parfera automates this process. When data is missing for the selected timeline interval, Parfera attempts to estimate the new column’s values based on the existing data. This estimation is referred to as Interpolation.
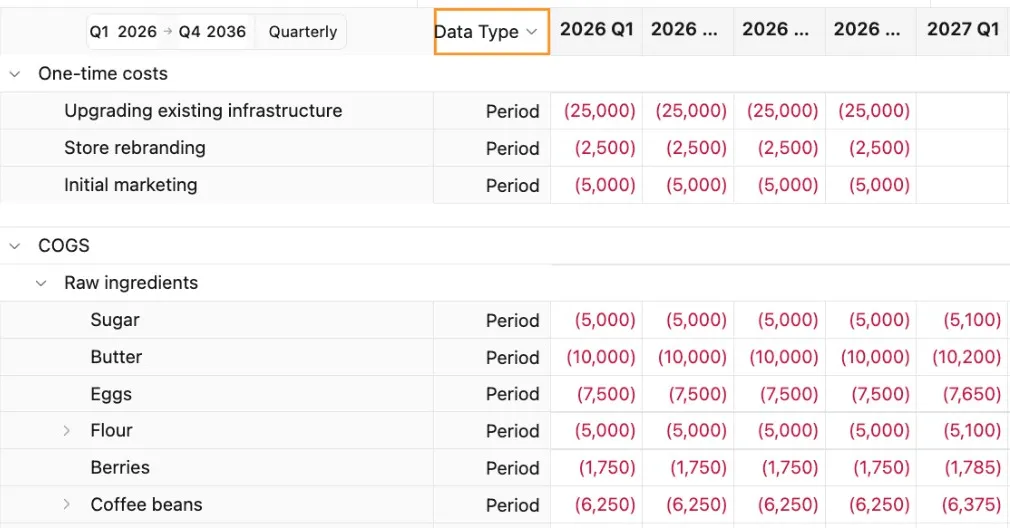 Version 1.0.6
Interpolation relies on assigning each row a data type: Passthru, Period, or Point. Use the dropdown to switch the Unit/Data type column to Data type before selecting the appropriate data type for each row. Units themselves are covered on the Units page.
Note: All rows are set to Passthru by default
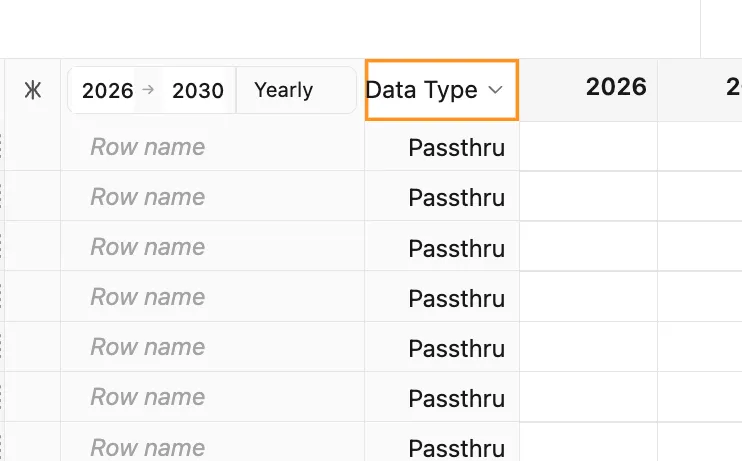 Version 1.0.5
To quickly set multiple rows to the same data type, select each row by clicking on the left end of the row before selecting a data type from the dropdown of any selected row.
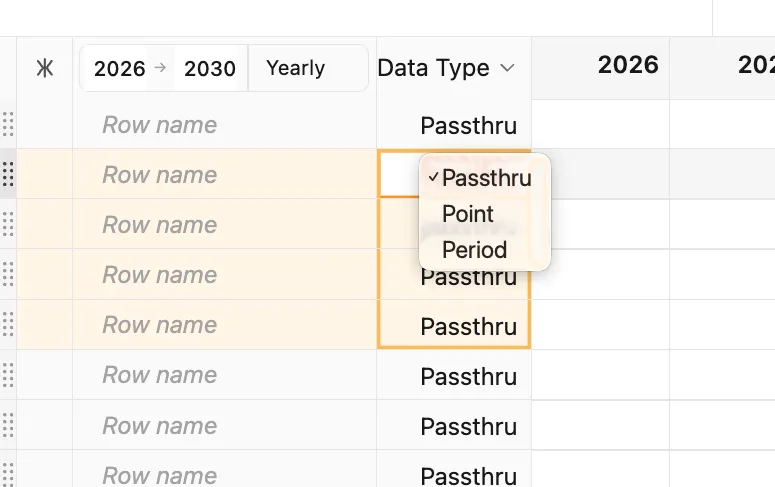 Version 1.0.5
Passthru
Section titled “Passthru”Passthru rows hold formulas or values that shouldn’t change even if the model’s time interval changes. The most common application of the Passthru data type is for rows that calculate their value entirely from other rows (e.g., Gross profit = Revenue - COGS).
When the sheet is changed to a shorter time interval, intermediate columns are populated with the original formula or value.
When the sheet is changed to a longer time interval, cells are populated with the formula or value equal to the last interval value defined by the user.
| Interval change | Equation |
|---|---|
| Yearly to quarterly | |
| Yearly to monthly | |
| Quarterly to monthly | |
| Monthly to quarterly | |
| Monthly to yearly | |
| Quarterly to yearly |
Period
Section titled “Period”Period rows hold values that represent a count of activity that occurred during the time-period specified by the column (e.g., “2024 Revenue” is a count of all revenue generated between January 1, 2024 and December 31, 2024).
When the sheet is changed to a shorter time interval, intermediate values are estimated by evenly dividing the original values by the number of new intervals.
When the sheet is changed to a longer time interval, values are generated by summing the values of shorter intervals within the new longer interval.
| Interval change | Equation |
|---|---|
| Yearly to quarterly | |
| Yearly to monthly | |
| Quarterly to monthly | |
| Monthly to quarterly | |
| Monthly to yearly | |
| Quarterly to yearly |
Point rows hold values that represent a point-in-time or snapshot taken at the end of the time-period specified by the column (e.g., “2024 Cash Balance” is a count of cash held on December 31, 2024).
When the sheet is changed to a shorter time interval, intermediate columns are populated with values by linearly interpolating the values from the original time interval.
When the sheet is changed to a longer time interval, cells are populated with values equal to the last interval value defined by the user.
| Interval change | Equation |
|---|---|
| Yearly to quarterly | |
| Yearly to monthly | |
| Quarterly to monthly | |
| Monthly to quarterly | |
| Monthly to yearly | |
| Quarterly to yearly |
Note: While Passthru and Point follow similar methodologies when moving from shorter to longer intervals, Passthru uniquely allows formulas to remain dynamic within the new time interval while Point populates a static final value from the period.